Boricua College Computer Lab


(EDU 33692) Students will choose a specific community research project and apply various online research techniques and Microsoft softwares to develop a community wiki. Students will present their results in class and submit them to the class wiki.

Tuesday, June 30, 2009

Class #8: This is It!

Let's get to it --

The exam


  1. Open the text file below, and format it in Word, so that it looks like the printed page I will give you.
    Text File
  2. Next, create a bar chart from the June budget data, and a line (not scatter) chart from the Monthly data
    Excel File
  3. Paste the two charts in blank PowerPoint slides
  4. Create a bulleted PowerPoint slide from the following text:

My Academic Skills
Computer: Microsoft Word, Excel, PowerPoint
Business: B.A. in Business, Including Statistics, Accounting, and Math I & II
My Work History
Worked as ParaProfessional in P.S. 181
Business Manager at Macy's
Secretary for Brooklyn Attorney
Interests/Hobbies
Hiking, Reading Mystery Novels, Taking care of my wonderful daughter

That's It!

Please make sure all of your previous work is uploaded to your wikipage, or save it to a flash drive and see me before leaving.

Facebook Me!

Tuesday, June 16, 2009

Class #6: Making It Look Good

It's not my war.
It's not my job.

-- 100 Rifles

What's Due?

Here's what I will be evaluating for your grades in two weeks:
  • Week #1: Blog postings with answers to the Internet questions. Research on a building/business/memorial in Northside Williamsburg, saved on your wiki page.
  • Week #2: Research on different New York City trees is to be listed on the wiki pages. The in-class activity, recreating a Word document from a printout will be part of the final evaluation.
  • Week #3: Research all Internet stores, public spaces, etc. in a 4 city block area. List your findings on the wiki page, and each group need to create 4 PowerPoint slides identifying building numbers, trees marked from the Natural Science Lab walking tour, and locations of these businesses. The PowerPoint file must be uploaded to the wiki page.
  • Week #4-5: Each group is responsible for creating several Excel charts, from downloaded data, and pasting the charts into PowerPoint slides. These techniques will be part of the final evaluation. The PowerPoint file must be uploaded to the wiki page.
  • Week #5: Each group is responsible for filling out the Word template for the list of trees chosen at the beginning of class.
  • Week #6: See below.

Objective


Today we will look into some PowerPoint skills you will need to take the final evaluation two weeks from today. Not next week. Instead of taking the final next week, we will travel to the Lifelong Friendship Society to observe a local "digital sweatshop" ;-) In other words, we will see how real people use real computers to make a living making computer animations. Some of LFS's clients include:

This week we will learn some basic graphics skills, including color templates, drawing objects, and slideshow animations. Your homework, listed at the bottom of this posting, will be to prepare for our field trip. Before we leave next week, each student will take a short quiz, to make sure everyone did the homework.

Color Spaces


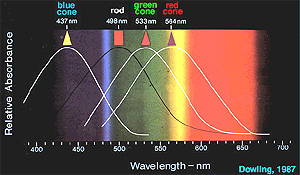
Working with color requires an understanding of how we "perceive" color. We aren't machines, passively reflecting various wavelengths of the world back and forth across our neural networks. We "process" the colors we see around us, in two basic steps. First, photoreceptors called rods and cones, found in the back of our eyes, are stimulated by specific wavelengths of light that appear red, green, or blue. In turn, the rods and cones release an electrical signal to retinal ganglion cells, whose axons take the information about light, now encoded as electrical signals, to the brain. UWash.


Hence the most popular kind of "color space," the Red-Green-Blue ("RGB") color space, is where colors are defined by the intensity, or "how much" Red, Green and Blue colors are contained in the specific color. We understand colors to be combinations of reds, greens, and blues, because that's how our eyes process wavelengths of light.

Any time you format the color of an object in Microsoft Office, you generally are working in the RGB color space. For example, let's format the background of a PowerPoint slide. Using the commands,

Format | Background | click on the dropdown window | More Colors

we see a hexagram with Red colors on one side, Green colors on another, and Blue colors on the third side. If we click on the 'Custom' tab, we can see the full spectrum of colors available in this color space.

Enter '0' for each of the RGB parameters. What color do you see? It stands to reason that a color with no red, green, or blue must be black. Now click and hold down on the up button on the red parameter, and see how the 'New' color changes. You are seeing a "color ramp" between black and red. Here is the entire color ramp.

There's another way colors can be referenced instead of by three RGB numbers. The Pantone color chart uses ramps to create light and dark colors. You can look for your own using their search engine (make sure to search by Name only).

So find a color you would like to use for your PowerPoint background, and specify the RGB values.

There are Internet names for colors as well (here's another one). But the three numbers usually aren't decimal numbers, they're hexadecimal, or base sixteen numbers. The 'Color HEX' numbers, show a series of 6 numbers or letters, the first pair characters represents the amount of red, the second pair the amount of green, and the third pair the amount of blue. These "numbers" are how colors are more commonly represented by computers, which have binary brains. Computers don't count in sets of ten, they count in sets of two. Therefore, computers often used "hexadecimal" numbers, or numbers grouped in sixteens--pairs of pairs of pairs of pairs. Here are some hexadecimal numbers:

Decimal Hexadecimal Decimal Hexadecimal

.......0.............0............16............10
.......1.............1............17............11
.......2.............2............18............12
.......3.............3............19............13
.......4.............4........... 20............14
.......5.............5............21............15
.......6.............6............22............16
.......7.............7............23............17
.......8.............8............24............18
.......9.............9............25............19
.....10.............A............26............1A
.....11.............B............27............1B
.....12.............C............28............1C
.....13.............D........... 29............1D
.....14.............E............30............1E
.....15.............F............31............1F

You don't need to know how to convert between decimal and hexadecimal, there are many online converters available. This converter is especially helpful, because not only does it convert hex to dec and visa versa, it also helps us choose color palettes that mix "complementary" colors. To understand what this means, we need to learn about another color space, the LAB space.

More Sophisticated Color Spaces


Remember the rods and cones? Once the electric signals are sent to the brain, information about color and about intensity of light is sorted into three "channels." Two of these channels carry color or wavelength information, and one carries intensity information-the degree of blackness or whiteness. One of the two color channels responds to red or to green light: here, certain ganglion cells will fire signals if stimulated by red light (messages sent by red cones) and will decrease firing if they get signals from green cones; other ganglion cells do the opposite. In the other channel, blue-yellow ganglion cells work the same way. The "intensity channel" also works in a similar manner: here, the sum of red, green, and blue cone input results in different ganglion cells detecting black, white, or shades of gray. (Remember that if all the colors of the visible spectrum are summed, they appear white.)


This is why if we mix red and green together, we don't see a reddish-green, we see yellow, because that's the way the occipital and temporal lobes of our brains process the retinal stimuli from our eyes.

Certain pairs of colors, like blue and yellow, and red and green, stand out well against each other, it is easier for us to distinguish these pairs of colors than say, red and orange. LAB color space, then, uses three number to define a color as well, the first represents the color's "luminosity," or how bright it is, the second how green or red the color is, and the third how blue or yellow the color is.

So go back to the Color Schemer, and choose a completely blue color (R=0, G=0, B=255). What are the other colors in the palette? The colors in the center (besides blue) are yellow, corresponding to the LAB color space just described. Red and purples complement green.

When you are creating a PowerPoint slide show, you should first think about four or five colors you would like to use for the text, graphics, etc. and stick with them. Nothing is more annoying than seeing blues in the first slide, then a bunch of reds in the second slide, and so on. A uniform "look and feel" is what you should be going for when you start designing color presentations.

So, based upon the color you chose for your background, find two or three complementary colors that will stand out against your background color.

A quick note to consider when choosing colors in PowerPoint

Even primitive graphics programs, like PowerPoint, offer an alternative color space. In the 'Custom' tab of the Colors dialog box, click on the drop down 'Color Model' menu, and select 'HSL'. This color space uses Hue, Saturation and Luminosity to define a color. Color Wheels are often used to describe hues of colors. A wheel, or circle circumscribes 36oº, where 0º means red, 120º means green, and 240º means blue. A high saturation is very grey, and a low luminosity is very black. Here luminosity is similar to LAB color space, but the only control for color is the hue.

Here's a color wheel that connects RGB, HSB (similar to HSL) and LAB to a specific color.

Creating PowerPoint Templates

We have spent a lot of time looking at colors, for what? As Fernando Lamas once famously said, "it is better to look good, than to feel good." Let's face it, you can't communicate a lot of information through PowerPoint unless your presentation consists of more than fifty slides, and I can assure you, there are few things more painful than sitting through several dozen PowerPoint slides. Keep them simple and eye-catching. And most importantly, keep them uniform.

Make sure you use the command Tools | AutoCorrect Options | 'AutoFormat As You Type' to uncheck the last four checkboxes.

Create a new PowerPoint file (Ctrl-n), insert three Title and Text Slides (Ctrl-m), and paste the following text into the boxes:

Boricua College

Pedagogy
Individualized Instruction
Colloquia
Modules
Degrees
A.B.
B.A.
M.S.

Pedagogy

Individualized Instruction – each student meets individually with a Faculty Facilitator for one hour each week.
Colloquium – 8-10 students meet each week with their Faculty Facilitator to exchange, share, discuss and evaluate issues related to their learning program.
Modules –


Degrees

Generic
The CORE Curriculum
The Associate of Arts Degree
Human Services
Bachelor of Science in Human Services
Master of Science in Human Services
Education
Bachelor of Science in Childhood Education (1-6)
Bilingual Education Extension Certificate (1-6)
Master of Science in TESOL Education (K-12)
Bilingual Education Extension Certificate (K-12)

The slides look ugly and boring, so let's punch them up a bit. First, apply your background color to the slide show.

The Slide Master


The slide you should spend the most time on is the 'Slide Master.' To access it, click on the menu command View | Master | Slide Master. The reason this slide is the most important one is that however you format this slide, all of slides you subsequently create will hold this formatting. In other words, whatever edits you make to the Slide Master are called "global edits," because the edits will appear on all of your slides.

There is nothing uglier than an Ariel font, so select the title box, and change the font to another sans-serif font. Don't choose a 'cute' font, like Palace Script, because cute fonts are usually unreadable. Once you have selected a nicer font, click on the 'Close Master View' button, and see what sort of global edit you made. You didn't have to change the title boxes for each and every slide, only once, in the Slide Master slide. Do the same thing for the text box, in the Slide Master (make sure you only have one font type on the slide!).

Observe that there is an outline format, that is, the first line has a larger, bolder font, the second line a smaller, less emphasized font, and so on. Click on the line that says, 'Click to edit Master text styles' once, and make the font a smaller size, but no less than 20 points.

What is a good complementary color to your background color? Make all of the text that color, and Close out of the Master View. Are your slides looking better?

Go back to the Master Slide View, and paste this graphic into the lower righthand corner.


Finally, using the 'Draw' toolbar, draw a horizontal line under the title box, holding down the 'Shift' button to make sure the line is straight. Select the line, and use 'Format Autoshape' to make the line 2.25 points. You can make your text slides even nicer by using the bold, italic and underline text formats to make specific words jump out.


The Draw Toolbar

You can use this toolbar to draw and color to your heart's desire. Let's start by drawing a circle.

  1. Create a blank slide.
  2. Click on the oval button next to the box button, and click and drag, holding the 'Shift' button down.
  3. Right click on the circle, and select 'Format AutoShape'.
  4. Click on the Color dropdown menu, and select 'Fill Effects'.
  5. Click on the 'Two colors' radio button.
  6. Choose two complementary colors
  7. Click on the 'From center' radio button.
  8. Hit 'OK' on each dialog box until they're all gone.
You have created a "gradient" object. This is like a color ramp, where one color slowly changes into another as you go left to right, top to bottom, or, in this case, center to rim. You could also change the outline color by Formatting the AutoShape and clickling on the Line color drop down menu to change the color.

Let's look at another fill feature.
  1. Click on the rectangle button next to the circle button, and click and drag, holding the 'Shift' button down.
  2. Right click on the square, and select 'Format AutoShape'.
  3. Click on the Color dropdown menu, and select 'Textures'.
  4. Click on the 'Woven Mat' swatch, and click on all of the 'OK' buttons.
Let's say you don't want a square, but a rectangle. Click on the square, roll over the right middle handle, and click and drag it until you have a long rectangle. Click and drag the top middle handle to make the rectangle thinner.


The 'Draw' button has some good actions on it. Keep the rectangle selected, and click on the 'Draw' button. Select the 'Rotate or Flip' command, and select 'Free Rotate.' The handles turn green, and if you click and drag on any of them, you will rotate the rectangle.

Drag the rectangle over the circle. Because you created the circle first, it will be under the rectangle. To bring it on top of the rectangle, click on it, then the 'Draw' button. Click on the 'Order' command and select 'Bring to Front'. Now the circle is on top.

The 'AutoShapes' button allows you to choose more complicated shapes, like moons and arrows. You can allow make line drawings using the following procedure:
  1. Click on the 'AutoShapes' button.
  2. Select 'Lines'.
  3. If you want to draw like a crayon, select the 'Scribble' button, and hold the left mouse button down while you draw.
  4. If you want to "connect the dots," select the 'Freeform' button, and click the left mouse from point to point until you're done.
  5. If you want to draw a curve, select the 'Curve' button, and click the left mouse from point to point until you're done. Each time you click a point, the curve will reshape itself to make as smooth a curve as possible.
Once you're finished drawing, you can move a specific point in the following way:
  1. Select the drawn object.
  2. Click on the 'Edit Points' button.
  3. All of the points will be highlighted with a small black box, and the cursor will change to a four arrows cursor when you roll over the point you want to move.
  4. Click and drag the point to the new position.
  5. You can also change the shape of the curve adjacent to the point by moving the Bezier points.

Animation


The best part of PowerPoint is making things move across the slide, so let's look at some simple animation techniques.

  1. Click on the object you want to move.
  2. Select Slide Show | Custom Animation.
  3. In the window that appears to the right, click on the 'Add Effect' button.
  4. Choose Entrance, Emphasis, or Exit for a standard motion.
  5. If you want the object to move in a particular, unusual way, click on 'Motion Path,' and draw a curve to the the path you desire.
  6. Click the 'Play' button to see how the animation will work.
You can also create actions when moving from slide to slide. Follow this procedure to do so:
  1. Make sure you are in 'Slide Sorter' view.
  2. Select Slide Show | Slide Transition.
  3. Click on the slide you are interested in, and choose a slide transition action from the list on the right side of the screen. I generally use a 'Slow' speed so I can see the motion
  4. Click the 'Play' button to see how the animation will work.

Homework


Expect to answer questions similar to the following for the quiz you will be taking at the beginning of next week's class.

What do each of these softwares do? (Click on the Play buttons to get a better understanding of the first four)

How would LFS apply the following animation techniques to produce the products listed at the top of this posting?
Finally, what is the difference between 2D 2 1/2D and 3D animation?

Tuesday, June 9, 2009

Class #5: Mixing It Up

Oh Saint Anthony, please help those students
who were forced to attend practice graduation
instead of today's class
Persevere towards passing this class!
As the title says, after this class, only three classes remain. Two weeks from today, we will have an evaluation that will go something as follows:

I will give each of you three printed pages, a page created from a Word file, and three PowerPoint slides. Two of the slides will have Excel charts on them, and the other slide is a graphics slide created straight in PowerPoint. Sample data in an Excel file, and pastable text will be supplied so that each student can reproduce what they see on the printed page in a Word, Excel, and PowerPoint file that each student will upload to their wiki page for evaluation.

Next week we will look at some of the more advanced bells and whistles in PowerPoint, but the skills you will need for the evaluation we have already investigated in previous classes. We will also prepare for the evaluation next week.

Today, here's what's on tap...

First things first. Each group needs to choose one of the following lists of trees to be researched:


List #1List #2List #3List #4
Norway Maple
Honeylocust
Ginkgo
Horsechestnut
Japanese Maple
Chinese Elm
Tree of Heaven
Hawthorn
Purpleleaf Plum
Willow Oak
Mulberry
English Oak
Red Maple
Callery Pear
Japanese Tree Lilac
Sugar Maple
Sycamore Maple
Zelkova
Goldenrain Tree
Crabapple
Serviceberry
Sawtooth Oak
Schubert Cherry
Dawn Redwood
Silver Maple
Pin Oak
Flowering Dogwood
Hedge Maple
Black Locust
Sweetgum
Eastern Redbud
Flowering Cherry
Hackberry
Magnolia
Northern Red Oak
Eastern White Pine
Green Ash
London Planetree
Katsura Tree
Amur Maple
American Elm
Kentucky Coffeetree
Tuliptree
Birch
European Hornbeam
Poplar
Swamp White Oak
Baldcypress


Once your group has decided on a list, post a comment to this blog, including the names of everyone in the group, and the list number. Once a list has been chosen, no other group may take it.

Objective

Each group needs to figure out who wants to do some tree research on the Internet, saving what they learn to a Word template, or dig deeper into Excel charts. Whatever you choose, we have already covered the material that will be covered in the evaluation two weeks from now, so whatever you choose will not affect your ability to pass the evaluation. If you choose the tree research, you can be working on it in this class with one eye on the Excel instruction I will be delivering, if you choose Excel, I need both of your eyes, as you will be creating more Excel graphs.

Tree Words


Basically, each group is responsible for filling out a form in a Word template for each tree in the tree list chosen at the beginning of this class. For each tree, use your Internet research skills to find out the following things about the tree:
  1. Its scientific (Latin) name
  2. Check the correct boxes at the top of the form (is it an conifer or broadleaf, etc.)
  3. Give a one sentence description for identifying the leaf, flowers, and tree dimensions.
  4. Find three good webpages (not the homepage!) that offer good information about the tree.
  5. A medium sized, black and white line drawing of a tree limb. When you are ready to paste a graphic into the form, get my attention, and I will show you how to do it.
  6. Make sure to include your name for credit.
I have created a sample form for the honeylocust tree for your reference.

And now to the Excel graphs...

Excel Charts, Part II.


Let's try using some detailed data from the United Nations site. In Panel 2, select the first variable, 'Population by five-year age group and sex' and your world region at the bottom of the right-hand list. Click on the 'Download as .CSV file' button.

CSV, or comma separated values, is a simple spreadsheet format. When Excel opens up a .csv file, it begins by placing the first letters or numbers into cell A1, until it reaches a comma. Then whatever is to the right of that comma goes into cell B1, until it reaches the next comma, and so on. A paragraph return means to stop putting characters in row A, and start the process all over again in cell B1. The most important thing about opening a .csv file in Excel is that as soon as it is open, save it as an Excel Workbook.

Saving as a tab in a workbook


Do you have your Excel file open from last week? If you don't open it now. Let's say you have downloaded a bunch of spreadsheets from the Internet and you want to consolidate them all into one book. Let's save the spreadsheet you just downloaded from the Internet to last week's Excel file.
  1. Right click on the single table in the UN spreadsheet
  2. Select 'Move or Copy'
  3. In the first dropdown menu, select last week's spreadsheet
  4. In the second menu, select (move to end)
Using this technique, you can keep all of your spreadsheets in one file. I would recommend doing this as you can be certain that whatever spreadsheet you may be looking for, you know it has to be in this one Excel file. And don't forget about using the Ctrl-Page Up/Down to move from tab to tab.

Let's look at the data. What we downloaded is a count of all the men and women in specific age group, in the past and into the future. What we want to do is create a graph that "stacks" all of the age group counts for a particular year into one large bar. We will have to use several techniques, sorting, pivot tables, and graph formatting to make this happen.

Sorting Fields


Sorting an Excel spreadsheet allows us to work with a smaller set of data in the table. In this case, we're not interested in the male/female counts, only the total number. Anytime you want to sort a spreadsheet, use the following key strokes:
  • Ctrl-Home
  • Ctrl-Shift-down arrow
  • Ctrl-Shift-right arrow
Now all of your data is selected. Just like when creating a chart, it is a lot easier to sort if you select the data you are interested in first. So now we can sort.

Either click on the button with the blue A, red Z and black down arrow, or select (use the Alt key, not the mouse!) the 'Data' drop down menu, and select the first option, 'Sort'. Make sure the 'My List has' radio button has the 'Header Row' option selected. Header rows are the first row in a spreadsheet, and each cell describes what the remaining data in that column means. In this case, we want to sort to get the 'Total' counts all by themselves, so in the first 'Sort By' dropdown, select 'Sex' and click on the 'Descending' radio button. After hitting the 'OK' button, you should see all of the 'Total' rows as the top of the spreadsheet.

Replacing Text


Now let's get rid of all the data we don't need, that is, all of the 'Male' and 'Female' records. Scroll down (using the arrow keys, or Page Down button) until you get to the first 'Male' record, which should be around row 443. Select the whole row (Ctrl-Shift-right arrow), then the rest of the data (Ctrl-Shift-End). Hit the 'Delete' key. Now the only data we have to work with is the 'Total' counts.

Go back up to the top of the spreadsheet (Ctrl-Home). The next thing we need to do is change some of the age ranges. I'll explain why later. Any cell in the 'Age' Column that has '0-4' must be changed to '00-04'. We could type the new range into each and every cell, but there is a faster way to do it, using the Replace function. Let's see how it works.

  1. First, go to the first cell that has the range '0-4' (are you using the keyboard?).
  2. Copy (Ctrl-c) that cell, which should be F2. The moving dotted line lasso should highlight that cell.
  3. Now select the entire F column (click on the 'F' cell).
  4. Use the Ctrl-f hotkey to bring up the Find function. We want to replace, however, so
  5. use the Ctrl-Tab hotkey to select the Replace tab in the dialog box.
  6. Now we can swap out all of the '0-4' cells in one fell swoop. In the first box, which says, 'Find what:' double click on the box so that the entire long box is highlighted.
  7. Paste (Ctrl-v) your search term ('0-4') into the box.
  8. Hit the Tab key to go to the next box.
  9. Type in ' 00-04' (the numbers, not the quotes) into the 'Replace With:' box. Make sure to include a space before the first zero.
  10. Hit the Tab button twice, and hit the 'Replace All' button.
Voila! All 14 cells have been changed! And you didn't have to type anything in the cells to make it happen. Like making charts last week, this technique is a little difficult to master, but you'll end up saving a lot of time (and making more money) if you master this skill.

Now swap out all of the ' 5-9' cells with ' 05-09'.

Pivot Tables

Go back to the Oceania PowerPoint file and look at the Age Trends slide. Are you getting a sense how the spreadsheet we have been editing for the last hour has something to do with the stacked bar graph? Look at the legend on the right side of the graph. See the age groups? Look at the X-axis labels. See the dates? We have the data, the only thing that remains to be done is figuring out how to use the Chart Wizard that we used last week to make the actual stacked bar chart.

Easier said than done, however. Do you see the problem? How many columns of data do we need to make this chart? Don't just look at the answer below. Look at the spreadsheet, and think about it.

.
.
.

Which columns of data do we need? Year, Age, and Value, so we need three columns of data. However, two dimensional graphs (X and Y axis) can only handle two columns of data. So what do we do? Remember this rule:

Whenever you have more than two columns of data to graph,
use a pivot table.
The easiest way to understand what a pivot table requires actually making one. So let's do it.
  1. Select all the data.
  2. Click on the 'Finish' button. Again, if you select the data before sorting, charting, or making a pivot table, your life will be a lot easier.
  3. A new blank spreadsheet should open up, and a 'PivotTable Field list drop down docker should be visible.
  4. Click and drag the Year field into the 'Drop Row Fields Here' box.
  5. Click and drag the Age field into the 'Drop Column Fields Here' box.
  6. Click and drag the Values field into the 'Drop Data Items Here' box.
You have made a Pivot Table! Now can you see how we're going to make that stacked bar graph? Each column represents a specific year, and each row represents a specific age range. There is one problem, the age sequence goes from 0-4, to 5-9, and the next one is 100+. This is why we had to swap out those age ranges. This pivot table views the age ranges as letters, not numbers, because of the dash in each cell. So the easiest thing to do is simply get rid of the 100+ values, most of them are zeros anyway. Click on the Age dropdown menu, and uncheck the 100+ box. Now the entire 100+ has disappeared.

Onto the Chart! Click on the Chart Wizard button. We have now created a pivot table, stacked bar chart. We should now format the chart, to make it look nicer. Make sure to do the following things:
  1. Delete the ugly plot area.
  2. Format the Y axis values as numbers with the 1000s separator on.
  3. Change the colors of each age range by right clicking on the first stack (0-4) and select 'Format Data Series.' Under the 'Patterns' tab, select a light fill color. Make the bars thicker by selecting 'Options' tab, and change the gap width to '50.'
  4. Right click on the next stack (5-9) and select a little darker fill color, and so on.
  5. When you're done, copy and paste the stacked bar chart into your PowerPoint slide.
Getting the feel of making graphs? Let's try one more.

Energy Graphs

Global warming is a big issue across the world right now, and one of its major causes is the burning of fossil fuels. So let's see how much oil each region of the world is burning.

Instead of saving a new tab into your Excel workbook, this time we will use the old fashioned "cut and paste" technique. So right click on one of your tabs and select 'Insert...' Double click on the 'Worksheet' icon to create a new blank spreadsheet in your Excel file.

Now open British Petroleum's world energy analysis world energy analysis spreadsheet. Click on the Row 18 'Oil Consumption' link. This tab offers historical data on each country's consumption of oil each year. Follow these step to get the information you need to create an energy graph.
  1. Select Row 3. Copy and paste that row into the first row ('A') of your blank spreadsheet.
  2. Let's say your group is doing North America. Select row 5, the 'US' row by click on the '5' cell. Copy and paste it into your blank spreadsheet on row 'B'. Copy all rows that list a nation in your region into your spreadsheet.
  3. Select all of your pasted data, except the last two columns (the % data).
  4. Create a stacked bar graph. Make sure to format the chart in the following ways:
  • Plot Area – hit the Delete button.
  • Title text – make it 16 point.
  • Axis text – make it 14 point.
  • Y axis – select the Number format from the list, use zero decimal places, and check on the 1000 separator.
  • X axis –make it 12 point.
  • Stacked barsRight click on the curve, select 'Format Data Series,' and choose some nice color backgrounds. Fatten the bars.
Repeat the process for 'Primary Energy: Consumption Mtoe (from 1965)', Row 51 on the 'Contents' tab.

  • Plot Area – hit the Delete button.
  • Title text – make it 16 point.
  • Axis text – make it 14 point.
  • Y axis – select the Number format from the list, use zero decimal places, and check on the 1000 separator.
  • X axis –Make the minimum 1950 and the maximum 2050.
  • Series curveRight click on the curve, select 'Format Data Series,' and choose the heaviest weight for the curve.

Tuesday, June 2, 2009

Class #4: Excel

Ola Hurrikan, great god of misery!
Please strike down those wooden puppets who have no respect for these computers!
Throw the malcontents up into the trees!
Please hear the cries of our Boricua students who cannot use the broken computers!

Check out the new tree map from another of my Science lab groups! For extra credit, see if you can include any of the trees in your PowerPoint slides.

Objective


Each of you will (surprise) work in groups of 3-5 and create a bunch of PowerPoint slides that contain Excel graphs generated by data you will download from several Internet sites. First, get yourselves in groups, and figure out which of the following world regions (except Oceania) your group will be investigating. Post a comment to this blog, including the names of everyone in your group, and the region your group will be responsible for. First come, first serve!

Reference Maps
Now let's take a look at what each group is responsible for. Open up the Oceania PowerPoint file
and page through the slides to get a sense of what your final product should look like. Answer the following questions:
  1. What is the list on the first page?
  2. What kinds of graphs are on the slides?
  3. What sort of information do the graphs communicate?
Each of you will be responsible for producing at least two of these slides. The more slides, the better the group's evaluation will be. Of course, each slide should look good as well, including font and color formatting. These Oceania slides should illustrate exactly what I am looking for in terms of presentation.

So how did I make these graphs? Let's look at the Excel file that I used to make them. But first, remember, don't panic if the file looks strange to you. We will be going through its creation step by step. So open up the


Let's look at how we can move through the file. Each 'page' is a 'spreadsheet,' or a graph that is created from data in another spreadsheet. At the bottom of the page are the 'tabs,' allow you to move between the various pages. You can use the mouse (arrrggg...) to click on a tab, or, hold down the Ctrl button, and hit the 'Page Up' or 'Page Down' button. The highlighted tab means you are looking at that specific spreadsheet page in the Excel book. Page back and forth through the Excel book to get a feel for what is in the Excel file.

So how did I get that data? If you go back to the PowerPoint file, you will see an Internet URL at the bottom right corner of each slide. So first we will download data from these websites, into an Excel file. Here are the steps to create the first graph:
  1. Go to the United Nations Population Division website.
  2. In the first box, select 'Population'
  3. In the second box, scroll down to the bottom of the list and select your group's region
  4. Click on the 'Download as a .CSV file' button
  5. Click on the 'OK' button to open the file in Excel.
  6. (Most important) Save the file as an Excel file with your name, to your flash drive.
Okay, this spreadsheet of data should look exactly like the first tab in my Oceania file. Many types of jobs, like financial analysts, medical researchers, and publishers rip data from the Internet, makes graphs from it, and show the results of their work to clients. You can make $25/hr easy if you learn the process I am now showing you. So keep focused!

Let's look at the spreadsheet. The most important numbers are the numbers under the 'Year' and 'Value' cells. It should be clear that we're looking at how many people have lived, are living, or will live in that region of the world at the given date. But looking at just numbers can be mad boring, so let's punch them up by making a graph with the numbers.

The $25/hr technique


The first step in making an Excel graph is to select the data. You can always use the mouse, but you know how I feel about that. What we want to do is selected the cell range from D1 to E22. How do we know where these cells are in the spreadsheet? The number refers to a specific row, the first row is labelled '1,' the second, '2,' and so on. You can see these letters on the left side of the spreadsheet. The columns are labelled in a similar way, using letters. So 'A' means the first column, 'B' the second column, and so on. To find cell D1, you find column D and row 1, and where the row and column intersect is the cell D1. So find it.

You should notice that the text, "Year" was typed into cell D1, and you can see that text in the spreadsheet at that location, as well as in the 'formula box,' which is located in the box just to the right of the 'fx' symbol. What text is in cell E1?

You should see the text, "Value" in cell E1. We're going to type the word, Population, into that box. So click on that cell with the mouse (ssss.....) or use the arrow keys to move to the E1 cell. Now we really must use the mouse. Click on the 'Value' text in the function box, and delete it. Type the word, Population, into the box, and hit the Enter key. See what happens?

Now we're ready to take the next step, actually making the graph. Before starting, however, we must select the data we want to graph. As you might expect, there are two ways to do this. One is to use the mouse (sob...), click in the upper left most cell, and, holding the left mouse button down, drag to the lower right most cell in the range of data to be graphed. The other way is to use the arrow keys to highlight the upper left cell, and, holding the Ctrl and Shift keys down, hit the down arrow once, and then the right arrow once. Now all of your data is selected!

Okay, so here are the steps to make a graph. Click on the 'Chart Wizard' button on the Standard toolbar, or on the Menu go Insert | Chart. Then follow these steps:

  • Step 1: Choose a type
  1. Column/Bar
  2. Line
  3. Pie
  4. Scatter
  5. Stock
  6. Custom Types
  • Step 2: Define the Data Range
  1. Highlight the data, using the button in the Data Range tab, or
  2. Type in the ranges using the Series tab
  • Step 3: Format the Graph
  1. Chart Title and Variable Names
  2. Legends
  3. Gridlines
  4. Labels (Pie Chart)
  • Step 4: Place the graph on the spreadsheet
  1. Using the mouse, left-click in the upper left corner of the cell the graph is to be placed
  2. Holding the mouse button down, drag to the lower right corner of the cell the graph is to be placed
  3. Release mouse button
  4. Holding the Alt key down, use the mouse to snap the graph into the range of cells.
Let's apply these step to making a graph like the second slide in the Oceania PowerPoint slide. Do you know what kind of graph it is, from the list in step 1? You may think it's a line, but you should avoid using line graphs whenever possible. Use a scatter plot instead. So select the 'Scatter Plot' button in Step 1. Then select the box that has no dots and two curves in it. Click on the 'Next' button.

Step 2 we can ignore, because we already selected the data. So we're on to Step 3, where we type in the Titles, select both X and Y gridlines, and turn off the checkmark for a legend. Then click the 'Next' button. For Step 4, let's use a simpler technique and click on the radio button that says 'As a new sheet.' Click on the 'Finish' button and we're done!

Of course, we need to make the graph look a little nicer, so here are some things we can do. Click on the following areas of the chart, and:
  • Plot Area – hit the Delete button.
  • Title text – make it 16 point.
  • Axis text – make it 14 point.
  • Y axis – select the Number format from the list, use zero decimal places, and check on the 1000 separator.
  • X axis –Make the minimum 1950 and the maximum 2050.
  • Series curveRight click on the curve, select 'Format Data Series,' and choose the heaviest weight for the curve.
Now you have a pretty graph, but nowhere to go with it. The last step is to bring it into PowerPoint. To do so,
  1. Click in the upper left corner of the chart until you see the handles selected. (This may take some time to get comfortable with)
  2. Copy it (Ctrl-c!)
  3. Toggle over to your PowerPoint file, and find the slide you want to place the graph on.
  4. DO NOT PASTE! You must 'Paste Special,' that is, on the menu, select Edit | Paste Special, and select 'Picture' from the list.


Voila! Your graph is now in a PowerPoint slide, ready for presentation.

Here are the PowerPoint files for each region:


North America
South America
Middle East
Europe
Africa
Asia

A lot of work, I know, but the process described above is always the same, no matter what kind of graph you make. And it's worth $25/hr to anyone who doesn't know the technique. So try to master the skill.

Now I would like each of you to choose a nation in your region (preferably one with a large population) and repeat the entire process. I promise I will help all of you do it.

Next Steps

Let's make a pie graph now.
  1. Go to the United Nations Development Programme website
  2. Hold down the Ctrl button, and select all of the countries listed on the first slide of your PowerPoint file. Click on the 'Add' button at the bottom of the box.
  3. In the Themes box, click on the 'To Lead a Long and Healthy Life,' and in the Themes box, click on the 'Demographic Trends.' Finally, in the Available Indicators box, select 'Population, total (millions)' Click on the 'Add' Button.
  4. Click on the 'Show Results' button at the bottom of the page.
  5. A new page will come up, with your population data. Click on the 'Export to Excel' button, and open up the Excel file.

You now have a new spreadsheet! Save it to your Excel file with the following technique:
  1. Right click on the tab at the bottom of the spreadsheet.
  2. Select 'Move or Copy.'
  3. On the 'To Book' drop down menu, select your file.
  4. Hit the 'OK' button.
Delete the 1975 data. Select the name of the countries, and the 2005 data. Make a pie graph using the techniques described above.

Energy Trends

http://www.census.gov/ipc/www/idb/
http://esa.un.org/unpp/index.asp?panel=1


Thursday, May 28, 2009

Interlude: Raising Resumes...

I hate writing my resume. I always associate resume writing with the deprivation of doing fun things. Last Monday, Memorial Day, a vacation day, a day I don't have to be responsible for work duties, I have already committed to retuning my resume so I can get a better job. (Sigh)

So how do I write a resume? It's sad that I have to spend my time learning how to do something I really don't want to do, wasting even more of my fun time. So here are a couple of good online tutorials:
There are two categories of resumes, the chronological resume and the functional resume. What are the differences? What are the basic sections of a resume?

Finally, every job sector has its own nuances of the resume form. Here are some examples.
People unfamiliar with word processing software tend to view computers as electronic typewriters. Using word processing software is like entering a new world, with fundamental questions to be answered, like what kind of font, or page margin, or paragraph justification should I use?

Living in America, most of the letters we write are business oriented. Examine the following formats:
For extra credit, answer the questions on this form.

Page Setup

Let's look at a very old resume of mine. I don't even know who this person is any more. Personality aside, let your eye look for various formatting techniques I use to make this resume.Here are some of the basic word processing techniques used to make the resume pop.
  • Portrait/Landscape layout
  • Page Margins
  • Header/Footer
  • Page View
    1. Normal -- text editing
    2. Page Layout -- for visual reference
  • View Paragraphs
  • Tools | Options | View

Headers & Footers

  • Tab Sets
    1. Left
    2. Center
    3. Right
  • Field Codes
    1. Date
    2. FileName
    3. Page
  • Reference Information

Format Selected Text -- Ctrl-d

  • Font
  • Size
  • Format
    1. Bold -- Ctrl-b
    2. Italic -- Ctrl-i
    3. Underline -- Ctrl-u
  • Effects -- super/subscript, small caps, shadow

Format Selected Paragraphs

  • Alignment
  • Indentation
  • Spacing -- Special

Numbered and Bulleted Lists

Tables

  • Select All -- Ctrl-double-click
  • Borders/Shading
    1. Cells -- Affect only selected cells
    2. Paragraph -- Affect only selected text
  • Using the Ruler
  • Cell Height/Width

Tuesday, May 26, 2009

Class #3: PowerPoint slides

Oh great computer golem! Please let >70% of the computers work this time,
let my class see the wonders of the Web and beyond! ;-)


So today we will begin using PowerPoint. Of the softwares that make up the Microsoft Office suite, PowerPoint is the most abused. It is intended to communicate information in a primarily graphic way, with a little bit of text interspersed throughout the slides. We will use it to develop a "community map" that other classes and residents of the Northside Williamsburg Brooklyn neighborhood can use.

Community maps can be very helpful in delivering information in a quick, easy to understand way. As an Internet application, there are many potential startup businesses that could be developed rather quickly. For example, I have a penchant for drinking beer, so I created a map of the neighborhood, showing where all of the bars and pubs are located. Beer Here!

We will develop our own mockup maps that will graphically store the following information:
  • Street names
  • Address numbers
  • Business/Points of interest
  • Trees located on the sidewalk
Today, working in groups of 2-3 (no more) we will access our wikispace to develop 4 city blocks using PowerPoint slides that map out one city block per slide. Each group will:
  1. Choose one of the six locations listed
  2. Use the 'Northside' PowerPoint file to locate the streets and addresses of each lot in the 4 city block area.
  3. Use Google Maps to identify any trees on the sidewalks in the 4 city block area, and
  4. Use search engines to located businesses, churches, etc. that have an associated web page
Each group should organize their tasks so that everyone is helping to produce one final PowerPoint file for the group. For example, one person could be responsible for every aspect of one city block. Or, one person could be responsible for locating every tree in the 4 city block area. However your group wants to organize the work, make sure that whomever is responsible for a particular slide types their name into that particular slide. Everyone needs to have a way to save their work (flash drives, floppy disks, email, etc.) so that everyone's work can be merged.

Tuesday, May 19, 2009

Class #2: Word!

Oh great projector eye! Defy me not this class,
let my class see the wonders of the Web and beyond! ;-)

So I looked over all of your feedback about what you'd like to learn in this class (soon to be only six classes...), and the common threads I pulled out were as follows:
  1. PowerPoint – basic and animation techniques
  2. Excel – mastering spreadsheet skills
  3. Additional Internet skills (virus detection, e-commerce, etc.)
There is typing software available on these computers (see ___). Unfortunately, we will not have time to look at Outlook, Publisher, or Java. I will try to at least show examples of web-based applications, but no full lessons on these subjects. Sorry!

So this week we'll look at Word, next week PowerPoint, and the following Excel. If any of you have specific questions about these softwares, post a comment to this blog, so I can focus the lesson to your needs accordingly.

Let's look at what we've done so far ...

We're well on our way to making a great community wiki! From the Williamsburg Preschool across the street, a pool in the neighborhood and art on the BQE (of course in Queens...), so much to learn about our neighborhood. Sweet memories of Harry Van Arsdale Jr.'s Local 3 beats rusty red paint any day. Let's barc for Our Lady of Mt. Carmel!

I can't wait to learn about Metropolitan Pool, Spoonbill & Sugartown, and Bedford Cheese Shop...

Please make sure to include actual links to specific webpages (google.com isn't very helpful) and also write a one or two paragraph summary about what you learned through your research.

So let's see what's on tap tonite...

Using Word to make nice looking documents:


How to avoid looking like all you're doing is cutting and pasting off the Internet

Let's start by seeing how well you can recreate a page in Word. After I hand out what the page should look like, format the following text and graphic, making the layout look exactly the way it looks on the handout page. "Exactly" means same font formatting, page margins, and paragraph formatting. Copy and paste the following text and graphic into a blank Word document, and see how closely you can make your Word page look like the one I handed out:

This is a Pre-Test! It's only a Pretest...
In the Event of a Real Test, You will be Provided Additional information...

Brooklyn's Northside Williamsburg Community will soon appreciate the efforts we are making to create an online archive of our collective memories of our neighborhood. By working with the Natural Science Lab's walking tours, we will memorialize their experiences online, making a reference for people in the future to look upon and remember how quickly our places are changing, even disappearing.


If all you do is "cut and paste" Internet text into a Word document, it's going to be real obvious what you're doing. At the very least, you should make the text look uniform, that is, have the same font formatting, and use your page margins to make the information look more like an academic research paper. Let's see how we can do that...

If you don't know anything about Word, the odds are you're going to treat it like a typewriter, which is a very bad thing. So let's get right to our first rule:

Rule #1: If you're hitting a key more than once, you're doing it wrong.

Hitting the space bar, the enter key, or any other button on the keyboard repeatedly so that you can get the words on the page where you want them (like horizontal or vertical centering) works on a typewriter, but it's the wrong way to go when using Word. So if you used the space bar or Enter key to try to get the words and graphics to line up like my page, you need to learn a new skill. Let's look at a couple of the basic techniques.
  1. Page Margins. Use a ruler to figure out what your white space measurements are for the top, bottom, left and right sides of the page. Then use the following command, File | Page Setup. The 'Margins' tab will allow you set the white space margins to the fraction of an inch. You can choose 'Portrait' or 'Landscape' layout, depending on how you want the information to fall on the page. The 'Layout' tab is also help in defining page borders and Header and Footer margins.
  2. Header and Footer. Did you notice how the top lines of text and the bottom line of text don't line up with the rest of the text, called the body text? This is because these lines are placed in the Header and Footer sections of the page. To access these parts, use the command, View | Header and Footer. Now you can cut and paste the first lines of information into the Header.
  3. Ruler. If you know how to use a typewriter, you know how to use a ruler. Use the command, View | Ruler to make it appear. You can change the length of the lines in a paragraph by 'clicking and dragging' the margin marks left and right. You never have to hit the space bar again if you know how to use the ruler.
  4. Field Codes. The footer line is made up of text that the Word document, not you, figure out. Use the command, Insert | Field to access the dialog box, and select whichever automated piece of information you what to include in the footer. I always include the FileName, Page Number, and Date and Time at the bottom of every Word page I create. It makes it easier for me to figure out where the document is saved on my computer if this information is printed out in the footer space.
Okay, let's step back from the page structure and figure out how to look at the page.

Rule #2: If you're squinting at the screen, you're doing it wrong.
Viewing a Page can be done in several ways. Clicking on the buttons on the lower left corner of the Word window allow you to jump quickly between the views. The most popular view are
  1. Normal. View the document this is best when you are typing, or working only with the body of the document – no footers, headers or page margin consideration. The text will look biggest in this view.
  2. Page Layout. If you're playing with the margins, headers or footers, this is the view you need to be in. So this view is where you should be if you're trying to make the page "look pretty."
  3. Print Preview. Save trees! Use the command File | Print Preview to get a look at how the page will actually look when it's printed out before you print it out.

Rule #3: The more you click the mouse, the stupider you become.
Using Word means formatting text. To format text, you first need to select text. Most people use the "click and drag" technique to highlight text. But you don't have to, and once you become mouse-free, you'll never go back! So let's see how we can use the keyboard to view and format text.
  1. The arrow keys. Instead of using the mouse to drag the "elevator" on the right side of a window up and down, you can use the arrow keys on the bottom right side of the computer to do exactly the same thing. The 'Page Up' and 'Page Down' buttons, above the arrow keys, do, surprisingly, exactly what they say.
  2. Selecting text. Using the arrow keys, place the cursor to the left of the first character you want to select, then hold down the 'Shift' key, and use the arrow keys to select the text you want to grab.
  3. Accelerator key. Holding the 'Ctrl' button while using the arrow keys allows you to move and select through a document twice as fast. Most important! Ctrl-Home takes you all the way to the beginning of the document, and Ctrl-End takes you all the way to the bottom of the document.
  4. The Hotkeys. You need to memorize these key combinations, so get them into your notebook:
Ctrl-z Ctrl-x Ctrl-c Ctrl-v
Ctrl-a Ctrl-s Ctrl-d Ctrl-f
Ctrl-q Ctrl-w Ctrl-o Ctrl-p
F1 F2 F4 F8 F9


Example of Tree Identification Dichotomous Key

NYC Leaf Key Official Report USDA Forest Service Report